2014 Form 4 Results

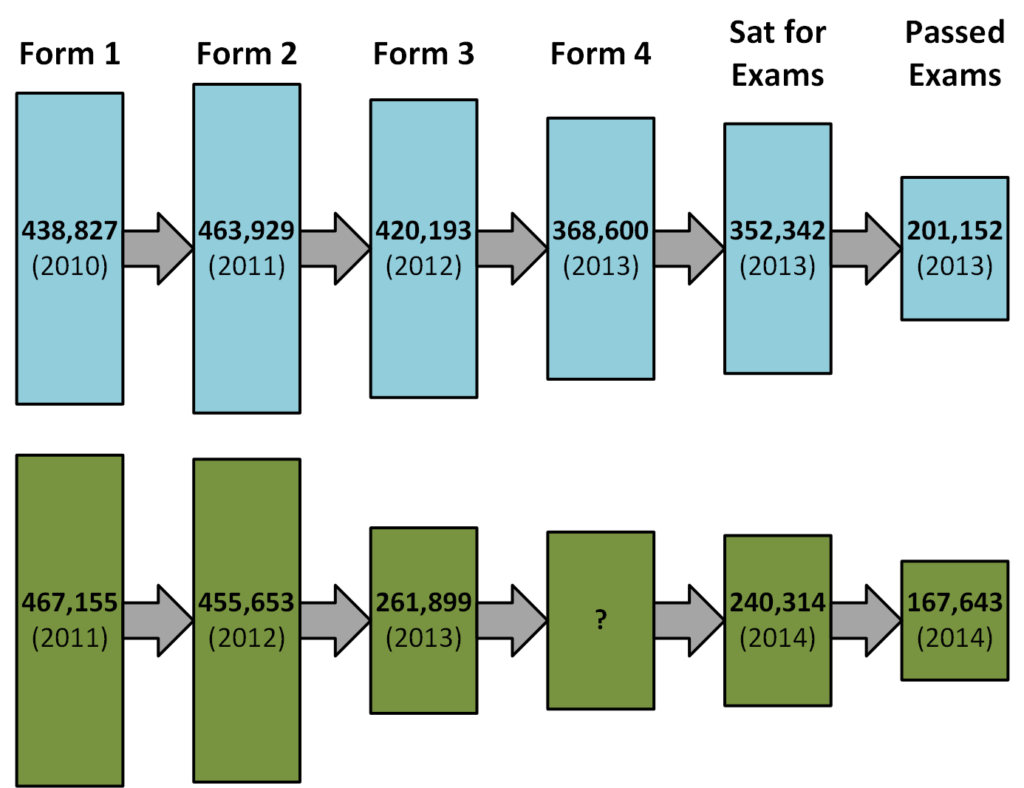
Form 4 examination results (mirror at maktaba.tetea.org) were released on February 14 and articles describing the announcement made by the government have been printed in several newspapers (See References). The Executive Secretary of NECTA declared that the pass rate for 2014 national examinations was 68.33%, a 10% increase from the previous year. This pass rate is just shy of the government’s Big Results Now (BRN) goal of a 70% pass rate this year. While this may look like an improvement, and was presented as such in the articles, a closer look at the numbers reveals that student performance decreased. The total number of students who passed the national examinations fell from 201,152 in 2013 to 167,643 in 20145. The increased pass rate isn’t due to improved performance by the students, but rather the result of a significantly smaller number of students sitting for the examinations. While the group of students who finished in 2014 entered O-level with a larger class than the previous year,  they were required to pass their Form 2 examinations in order to continue to Form 3. Many of their classmates were forced to repeat Form 2 or end their studies after failing the examinations. The students who finished in 2013 didn’t have this condition so most of their class continued to Form 4 and sat for the examinations. The figure below shows the stark difference in the transition between Form 2 and Form 3 for the classes of 2013 and 2014 (examination statistics are from 5 and enrollment numbers from 6).

form4Results

  The government has been using the pass rate (the number of students who successfully pass the examination over the number of students who sit for the exam) as the metric to define school performance and the health of the education sector as a whole. However this doesn’t seem to be a good statistic when comparing the O-level results from the past two years since the attrition rate before Form 4 was so different. Contrary to the announcements in the press it seems that the CSEE examination results have deteriorated this past year. In the U.S., one of the measurements used to evaluate schools is how many students graduate after 4 years. Looking at the CSEE results in this way paints a different picture. In addition to fewer people passing the examinations in 2014 than in 2013, the numbers also show a drop in the percentage of students who successfully complete O-Level. Looking at last year’s exams, 45.8% of students who started Form 1 in 2010 went on to pass their Form 4 exams. For this year, the percentage dropped to only 35.9% of students who started Form 1 going on to pass their Form 4 exams. This represents a drop of nearly 10%. While people may point to the increased pass rate as a percentage of students taking the exam as evidence that BRN is working, the increase in pass rate can be traced back to the 2012 decision to only permit students who pass the Form 2 examination to join Form 3. The truth, however, is that there are more students who are not finishing their secondary education then there were a year ago.

References

1. Notable Improvement in Form Four Results, Daily News 2. Shule Binafsi Zatesa Matokeo Kidato cha Nne, Mwananchi 3. Matokeo Kidato Cha IV: Shule za Serikali, Seminari, Vipaji Maalumu Zaporomoka, Mwananchi 4. O-level Results: Girls, Private Schools Shine, The Citizen 5. Ufaulu Kidato cha Nne 2014 Wapanda kwa Asilimia 10, EATV 6. 2013 Basic Education Statistics in Tanzania, retrieved from moe.go.tz (currently undergoing maintenance)

Relative Smartphone Penetration in Tanzania

Smartphone penetration in Africa has been rapidly increasing the last few years. Tanzania is no exception; smart phones are common in cities and especially among youth who are studying in, or have recently completed, higher education. According to an article in the Tanzania Daily News the smartphone market in Africa has been growing 19% annually and the increase in availability of cheap smartphones is expected to continue this growth. The map below shows our estimate of relative smartphone penetration by region. We generated the estimate from Google Analytics data on our resource website. This year we mirrored the Primary School Leaving Examination results soon after they were posted by the Tanzanian government. The results are structured in such a way that a user selects a region and then district before receiving a list of schools. We took the Google Analytics data for just the region webpages and filtered them to give us the unique pageviews by mobile devices. Then we divided the unique pageviews by mobile devices by the number of students who had registered for the examinations in each region (which was scraped from the results). Finally, we divided by the region with the highest ratio to normalize the data.  
Some caveats to the map:
  • There were a relatively low number of visits to the site for some regions (three were visited less than 200 times). In total there were just over 10,000 unique pageviews for regions compared to 792,122 pupils who sat for the exam. It would be much more instructive if the government did a similar analysis on their website which undoubtedly receives significantly more traffic.
  • The data is probably skewed by private schools. Even at the primary level some wealthy parents (who are more likely to own smartphones) send their students to private boarding schools. Private schools aren’t evenly distributed across the country, so regions with a higher concentration of elite schools (e.g. Dar, Kilimanjaro, Arusha) may be getting hits from parents who live elsewhere.
  • Within regions there is a high degree of variability. For instance in the Kilimanjaro region our estimate of smartphone penetration is 2.2 to 5 times higher in Moshi (the regional capital) than other districts. A similar map using districts would highlight the locations of larger cities while most of the country would have even smaller penetration ratios.

Free Secondary Education?

The Tanzanian government has committed to providing secondary education for free starting in 2016, as was reported in Free Secondary School Education Spot On. This will certainly be a popular move by the government, both among donors and the general population. However, it remains to be seen whether secondary education will truly be free. In 2001 the government declared that primary school would be free the following year. While government schools did stop requiring school fees, many schools had (and continue to have) mandatory contributions [The Cost of a ‘Free’ Primary Education in Tanzania]. While contributions are slightly different from fees in that they are not imposed by the government itself (but rather the individual school), in practice they have the same effect – students must fulfill the contributions or risk being barred from classes. Some of these contributions can be physical items (e.g. paper or stools), but often money is collected for a variety of reasons like lunch programs (paying cooks and purchasing cooking oil, salt, etc.), security, and paying per diem to teachers attending conferences. These required contributions continued and were often increased to offset lost revenue from the eliminated school fees. At the secondary level there are even more mandatory contributions; some schools can have a half a dozen or more different funds to which students are required to contribute. As a result, it is not uncommon for mandatory contributions to be greater than the fees at secondary schools. Hopefully the government plans to eliminate both fees and mandatory contributions, otherwise this new initiative will not result in secondary school being affordable to everyone. Furthermore, there is the potential for effectively no difference in the financial burden for parents if schools are allowed to increase the amount students are required contribute.